Zitat:
Granite is America's Infrastructure Company
Granite is one of the largest diversified construction and construction materials companies in the United States as well as a full-suite provider in the transportation, water infrastructure and mineral exploration markets. Granite is an industry leader in safety and an award-winning firm in quality and sustainability.
|
https://www.graniteconstruction.com/company
+++++++++++++++++++++++++++++
Zitat:
Granite Construction Inc. is a member of the S&P 600 Index based in Watsonville, California, and is the parent corporation of Granite Construction Company, a heavy civil general contractor and construction material producer.
Incorporated in 1922 and publicly traded since 1990, Granite Construction Company is composed of a materials division and two geographically divided operating divisions (Granite West, located in Watsonville, and Granite East, located in the Dallas-Fort Worth Metroplex suburb of Lewisville, Texas), under which are several regional offices.
Granite specializes in both public and private sector transportation infrastructure projects that include: roads, highways, tunnels, bridges, locks and dams, mass transit facilities and airports. The materials division produces construction materials such as sand, gravel, ready-mix and asphalt concrete.
|
https://en.wikipedia.org/wiki/Granite_Construction
+++++++++++++++++++++++
Unternehmens-Pressemeldungen: https://www.graniteconstruction.com/...y=16&year=2021
++++++++++++++++++++++++++++
WKN: 879080 ISIN: US3873281071
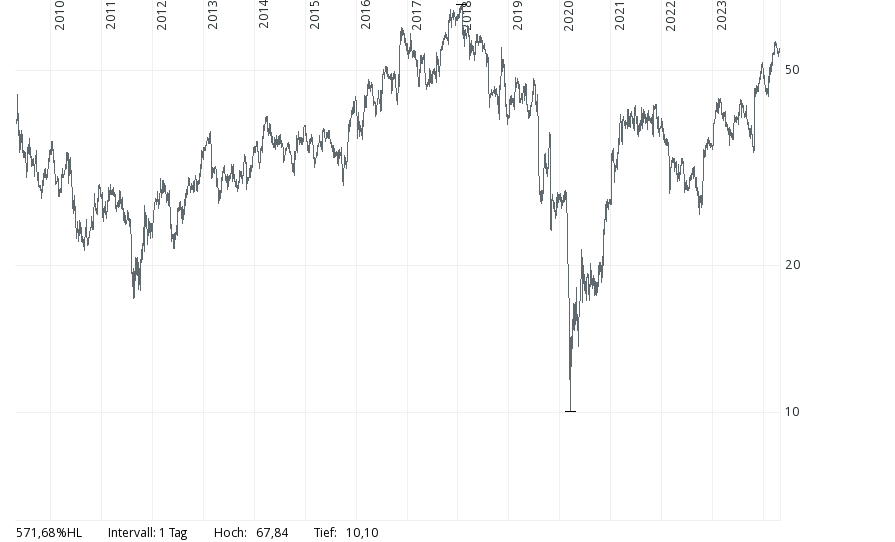
Mein rechnerisches Kursziel ist mindestens die 161,8%-er Extension bei 175,77 US-$, errechnet vom 15y-Chart unten, dort:
Low 10,1$ zum
Hoch 73,38$
Aktuell: 38,63 USD, Stand 26.03.21 - 21:10 Uhr
Das entspricht einem Potential in $ von Faktor 4,55 
Hinzu käme noch der Gewinn aus der Dollar-Aufwertung, die seit dem 06.01.2021 als Langzeittrend parallel dazu laufen dürfte...
Allerdings ist das eine
lineare Kurszielberechnung; korrekt müsste sie
logarithmisch berechnet werden, siehe unten.
Das logarithmisch berechnete Kursziel liegt sogar noch etwas höher als jene 175,77 US-$!
 Kurzfristiges Kursziel:
Im logarithmischen 4-Stunden-Chart ist die logarithmische 162er Extension
45,19$.
Analog ist das kurzfristige Kursziel in 38,55 (L&S-Kurse in ). Letzter Kurs am Freitag war 33. Das Kursziel 38,55 entspricht dann rechnerisch +16,82% - wohl noch im April.
 Logatithmische -Kurse bei L&S:
Folgend eingeschoben etwas Hintergrund zur korrekt logarithmischen und falsch linearen Berechnung von Retracements bzw. Extensionen.
################################################
Die Fibonacci Retracement Levels sind ein Abstandsmessinstrument und kein Kursmessinstrument.
Auf einem Chart mit einer logarithmischen Skala bedeutet dies, dass jeder identische vertikale Abstand auf dem Chart (Retracements bzw. Extensionen) der gleichen prozentualen Preisänderung entspricht.
Trader sollten daher immer logarithmische Fibonacci Retracement-/Extension-Levels auf logarithmischen Charts verwenden!!!
Etwas sehr merkwürdig erscheint daher auf den ersten Blick das tiefe Tief bei 10,1$. Das liegt weit unter dem rechnerischen - linear berechneten - 76,4%-Retracement bei 22,75$, was als solches schon ein eher tiefes Retracement bei einer Aufwärtsbewegung ist.
 Als Erklärung dient
- erstens, dass die Charts, die ich zu dem Wert kennen, nicht den Zeitpunkt "Null" abbilden: das Unternehmen wurde 1922 "incorporated". Der an sich hier zu verwendende Tiefpunks-Kurs dürfte wohl deutlich tiefer liegen als der hier verwendete Tiefpunkt-Kurs.
- zweitens, dass Retracements + Extensionen über lange Zeiträume (wie in diesem Fall) logarithmisch berechnet werden sollten, siehe dazu folgend mehr Hintergrund. Leider kenne ich dazu keinen Online-Rechner.
Hier folgend 2 Quellen zur obigen zweiten Erklärung:
Nr. 1:
Zitat:
|
Fibonacci retracements are automatically included on all daily, weekly, monthly and quarterly charts. Since prices are plotted on a logarithmic scale on the charts this means that any identical vertical distance on the chart is the same % price change. You can easily verify the retracement levels by holding a piece of paper to the chart and marking the distance from the circled high to the 50% retracement. Then measure the distance from the circled low to the 50% retracement. The 2 distances will be equal.
|
https://www.hotcandlestick.com/fibon...price%20change.
+++++++++++++++++
Nr. 2:
Zitat:
Linear Fibonacci Retracement Levels are being widely used as a trading tool, in the traditional market and naturally traders try to replicate this technique in the cryptocurrency market. But as the volatility of the cryptocurrency market is so much higher than traditional markets, they only tend to work on small time frames or small moves; when trying to apply them in daily or weekly candlestick it becomes obvious quite quickly that it is an exercise in futility (believe me I have been there)
The Fibonacci Retracement Levels is distance measuring tool and not a price measuring tool. This makes no difference when someone is using linear scale charts to make his Technical Analysis (TA), but it gets out of wack when being used on log charts.
|
https://wisetrader.io/f/logarithmic-...acement-levels
################################################
In US-$, log. Skal.:
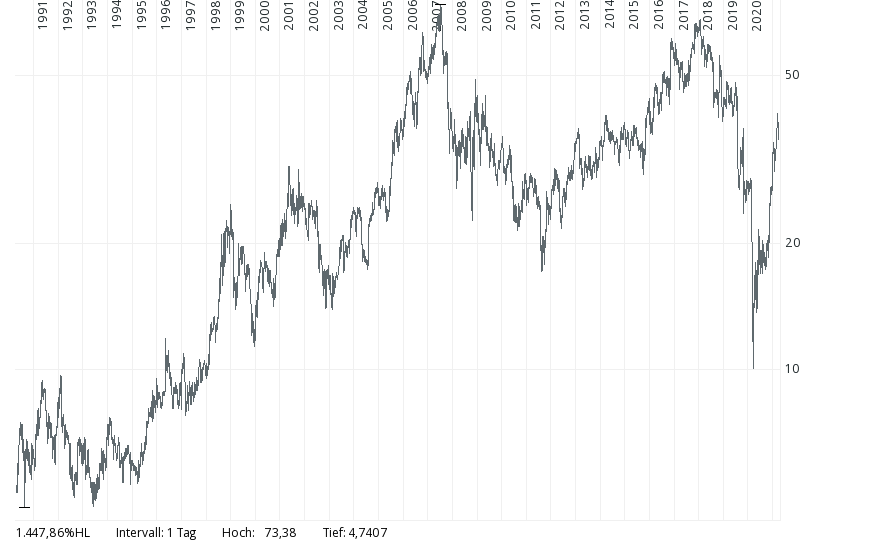
15y:
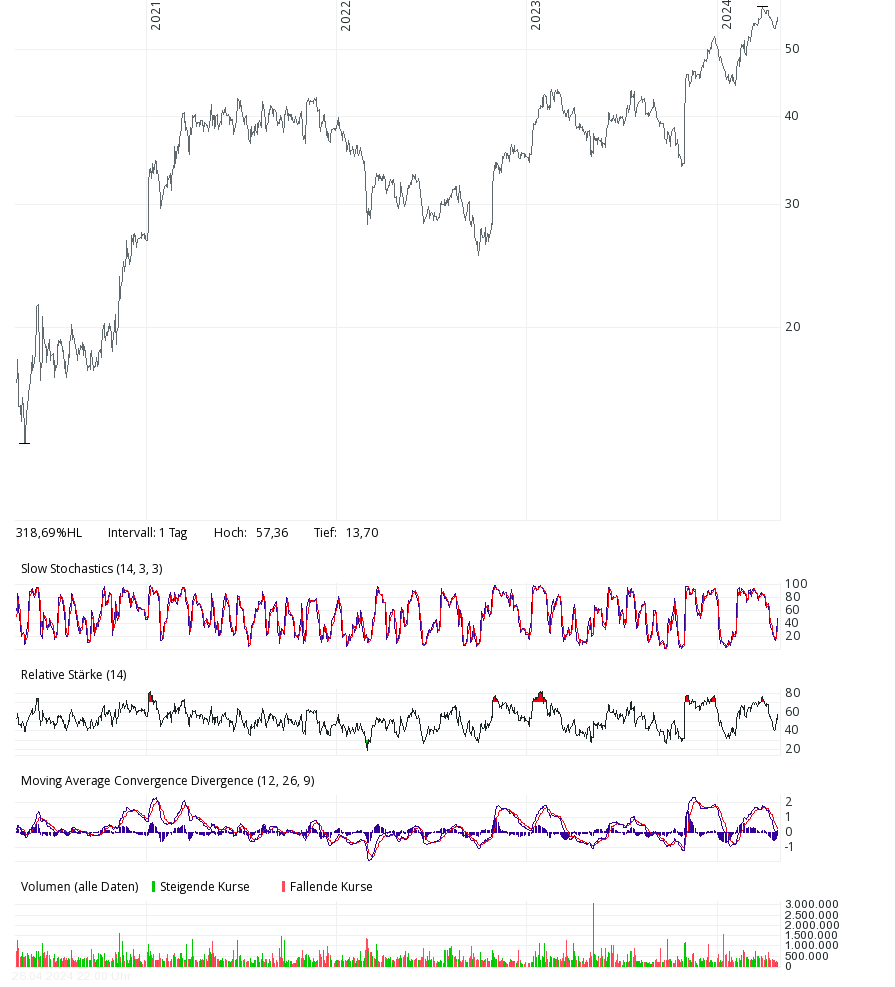
4y:
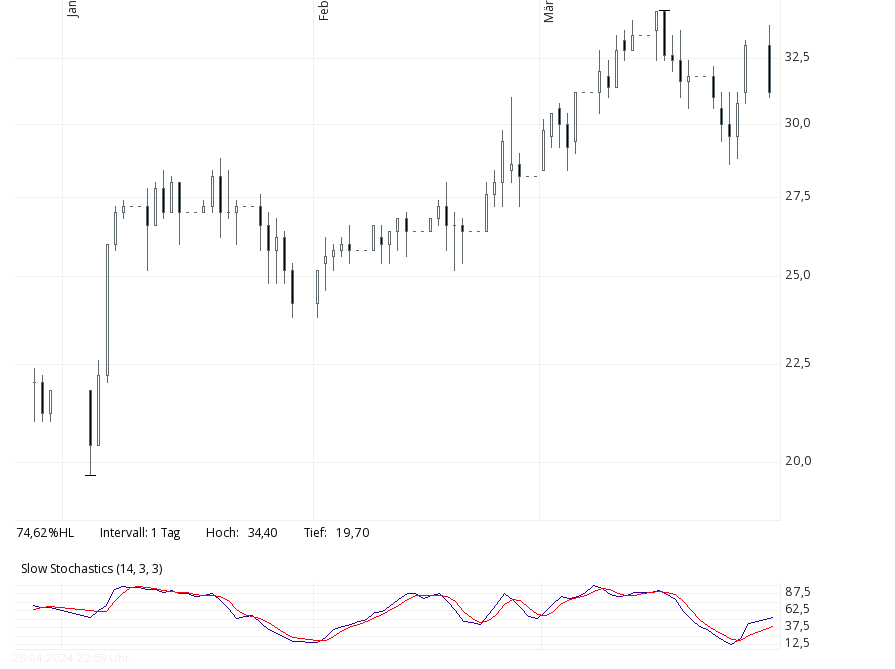
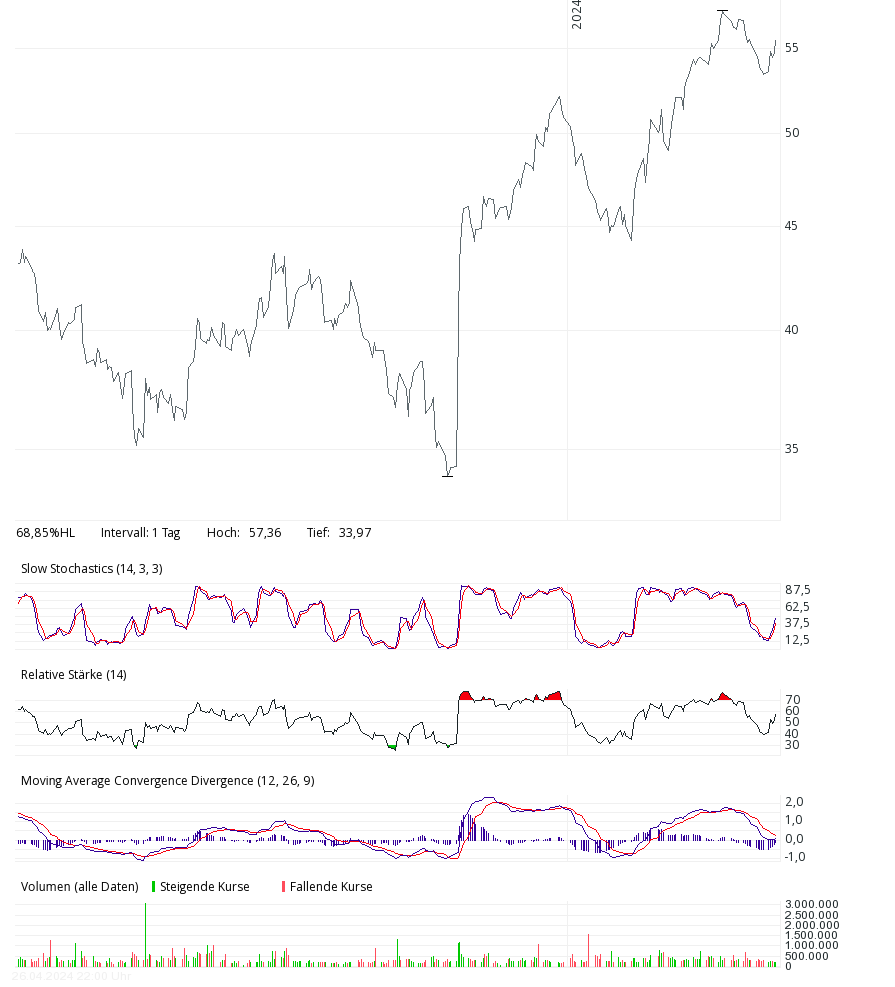
14m:
6m:
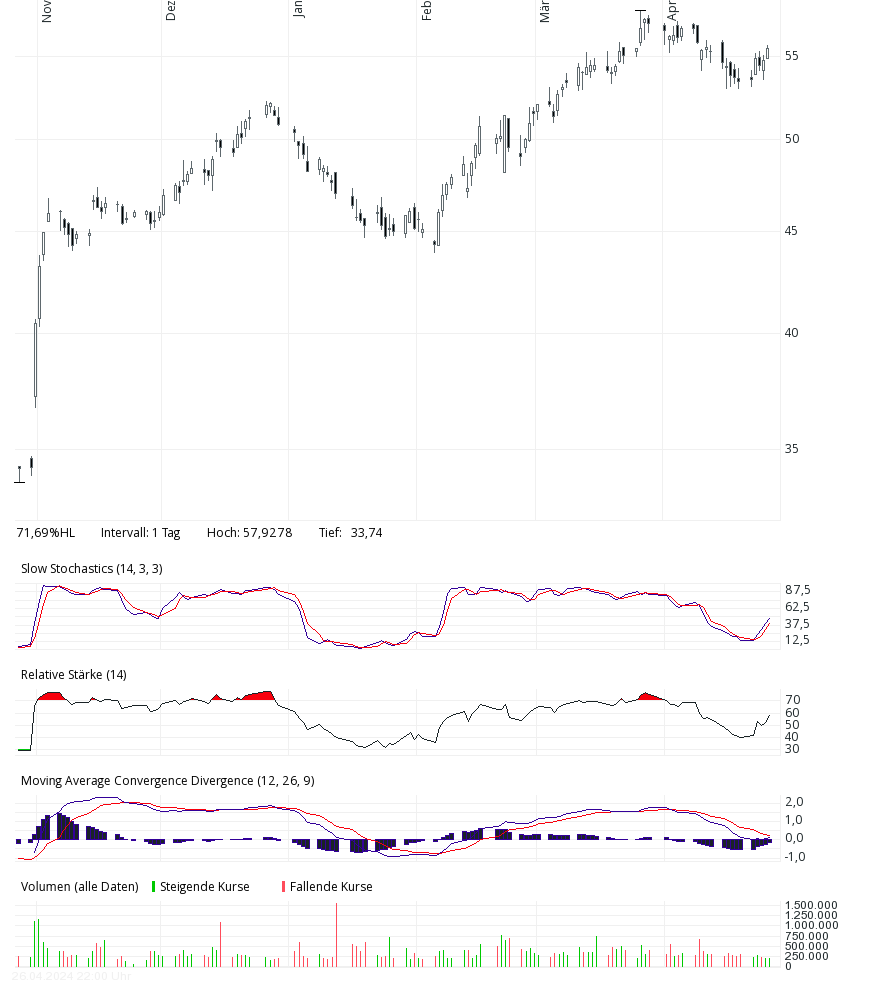
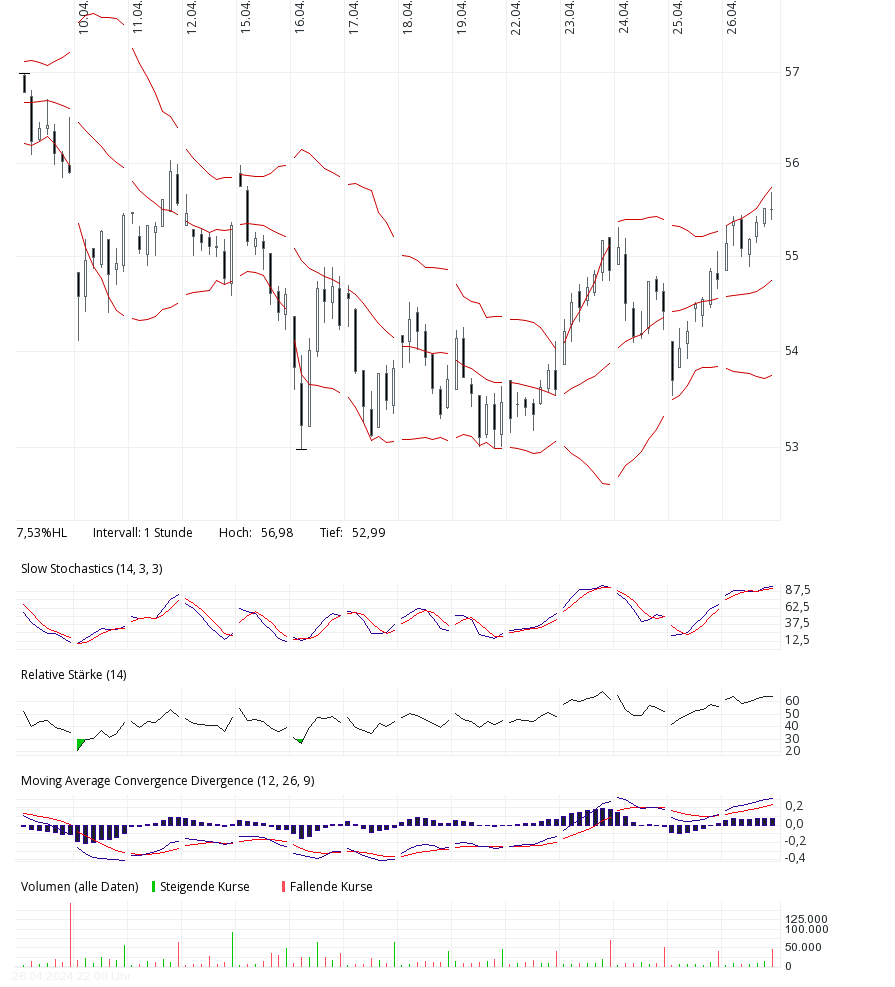
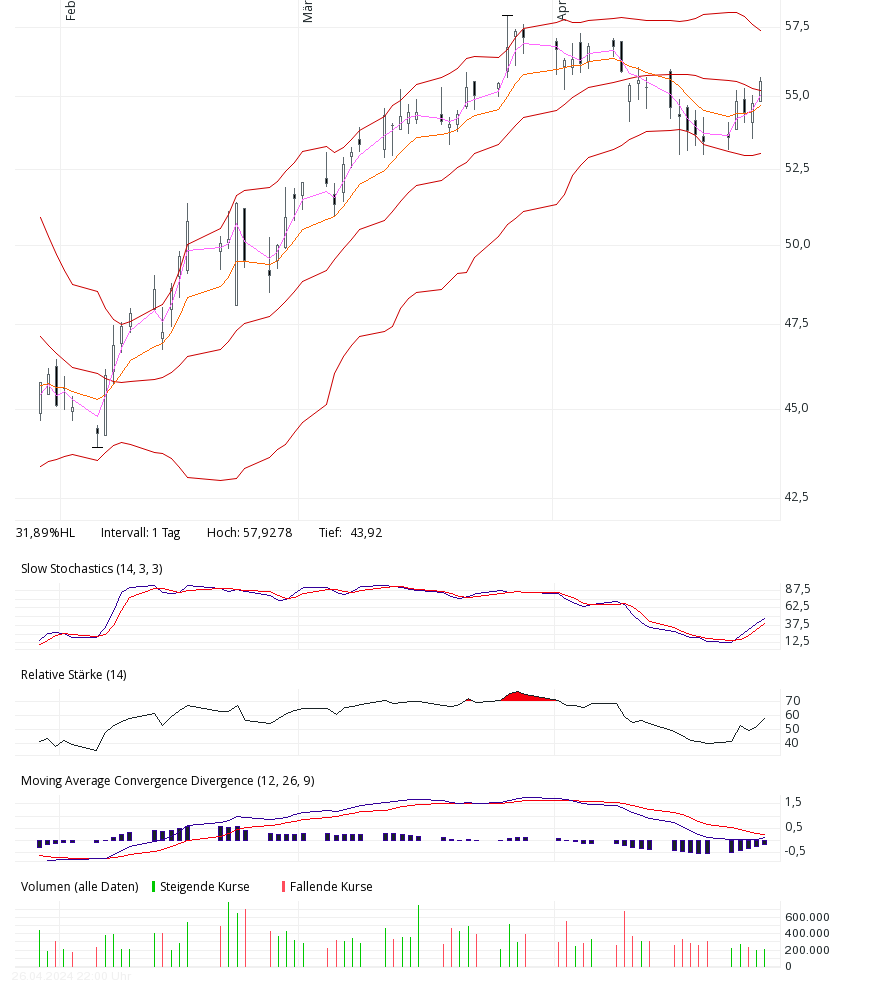
3m, mit Bollinger + den EMAs 9, 3:
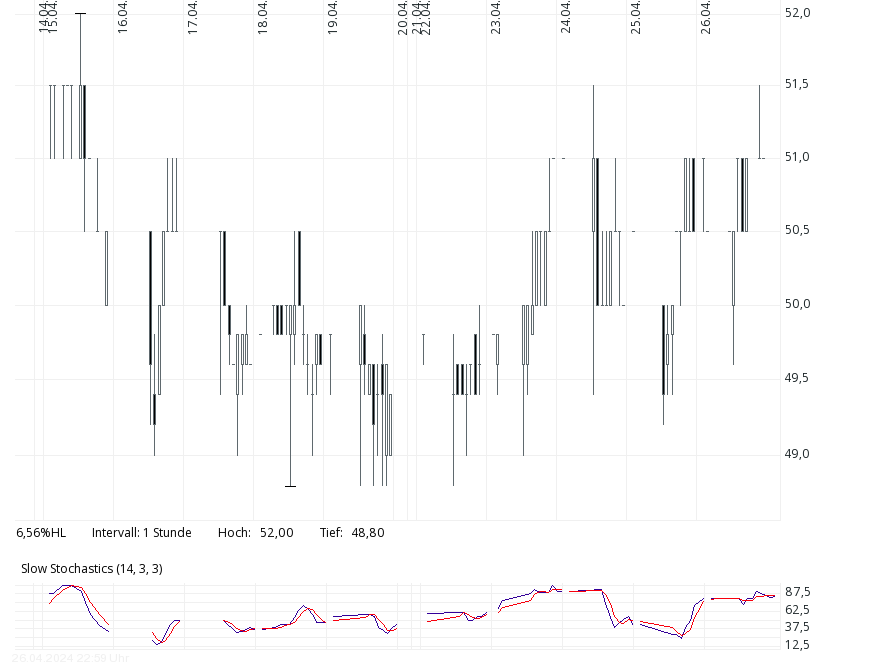
14d: