02.09.2013, Guy Wagner, Banque de Luxembourg:
Quelle.
http://www.businessclub-luxemburg.de...eba02616454ac0
http://www.spiegel.de/wirtschaft/unt...-a-919345.html
US-Aktien so teuer wie vor 75 Jahren:
http://www.handelsblatt.com/finanzen...3270392-2.html
Zitat daraus:
Zitat:
|
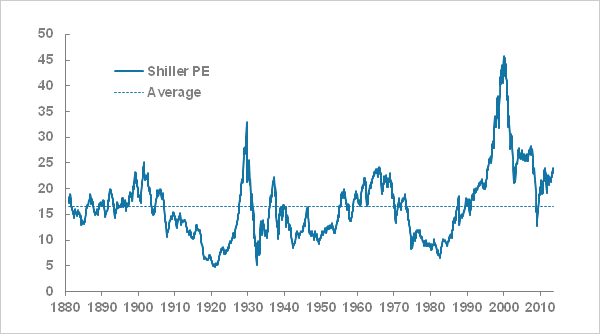
Auffällig ist, dass diesmal einer langen Phase massiver Überbewertung in den 90ern nur ein kurzer Abschnitt folgte, in denen Aktien relativ günstig zu haben waren (2002). Anschließend schoss das Shiller-KGV sofort wieder nach oben. Blickt man jedoch in die Vergangenheit, dann folgten Phasen mit langer Überbewertung stets ebenso lange Zeiträume, in denen Aktien günstig waren, wie in den 70ern und 80ern. Ausgeprägte Bärenmärkte endeten erst dann, wenn Aktien zuvor lange Zeit wenig kosteten.
|
-------------------
Zitat:
|
As the chart below illustrates, the P/E10 closely tracks the real (inflation-adjusted) price of the S&P Composite. In fact, the detrended correlation between the two since 1881, the year when the first decade of average earnings is available, is 0.9976. (Note: A perfect positive correlation would be 1 and the absence of correlation would be 0).
|

Zitat:
|
in times of critical importance, the conventional P/E ratio often lags the index to the point of being useless as a value indicator.
|
Zitat:
|
Shiller refers to this ratio as the Cyclically Adjusted Price Earnings Ratio, abbreviated as CAPE, or the more precise P/E10, which is my preferred abbreviation.
|
Zitat:
|
We can also use a percentile analysis to put today's market valuation in the historical context. As the chart below illustrates, latest P/E10 ratio is approximately at the 89th percentile of the 1592 data points in this series.
|

Zitat:
|
A more cautionary observation is that when the P/E10 has fallen from the top to the second quintile, it has eventually declined to the lowest quintile and bottomed in single digits. Based on the latest 10-year earnings average, to reach a P/E10 in the high single digits would require an S&P 500 price decline below 550. Of course, a happier alternative would be for corporate earnings to continue their strong and prolonged surge. If the 2009 trough was not a P/E10 bottom, when might we see it occur? These secular declines have ranged in length from over 19 years to as few as three. The current decline is now in its 13th year.
|
Quelle mit diversen weiteren Charts:
Is the Stock Market Cheap? By
by Jill Mislinski, 12/1/16 (Doug Short)
http://www.advisorperspectives.com/d...-Valuation.php
http://www.advisorperspectives.com/d...k-market-cheap